The Team Performance section on the dashboard gives managers and admins a bird’s-eye view of how the team is executing across the pipeline. It’s where you go to understand not just what’s happening, but who’s driving results.
Accessing the dashboard
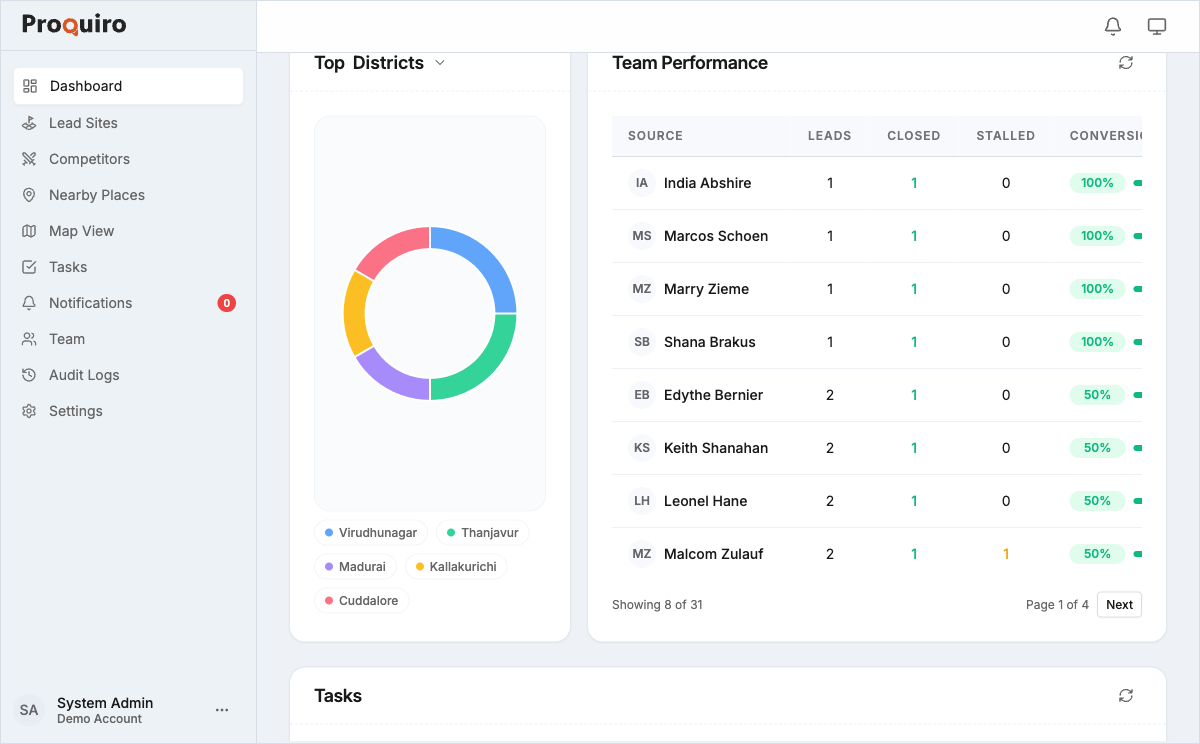
The Team Performance table appears on the main Dashboard, below the Intelligence Layer and Top Districts sections. Scroll down past the district rankings and you’ll find it.
What you’ll see
The table lists each team member with the following columns:
- Source — the lead source or channel attributed to that member, so you can see which channels are feeding which people
- Leads — total number of leads assigned to them
- Closed — how many leads they’ve successfully closed
- Stalled — leads with no recent activity (a high number here is a signal to check in)
- Conversion — the member’s lead-to-close conversion rate, arguably the most telling metric of the bunch
Tip: Sort by Stalled to quickly identify where leads might need reassignment or a follow-up nudge. A stalled lead isn’t necessarily lost — sometimes it just needs fresh attention.
Filtering
Use the date range picker to adjust the reporting window. You can also filter by specific team members to compare individual performance side by side. This is particularly helpful during weekly reviews or one-on-ones.
Who can access this
Only Owner, Admin, and Manager roles can view the Team Performance section. Field Executives and Lead Assistants see only the standard dashboard. This keeps sensitive performance data visible to the people who need it for coaching and planning.