The map view gives you a bird’s-eye view of every lead site, competitor, and nearby place — so you can spot geographic patterns and make location-aware decisions without switching between pages.
Accessing map view
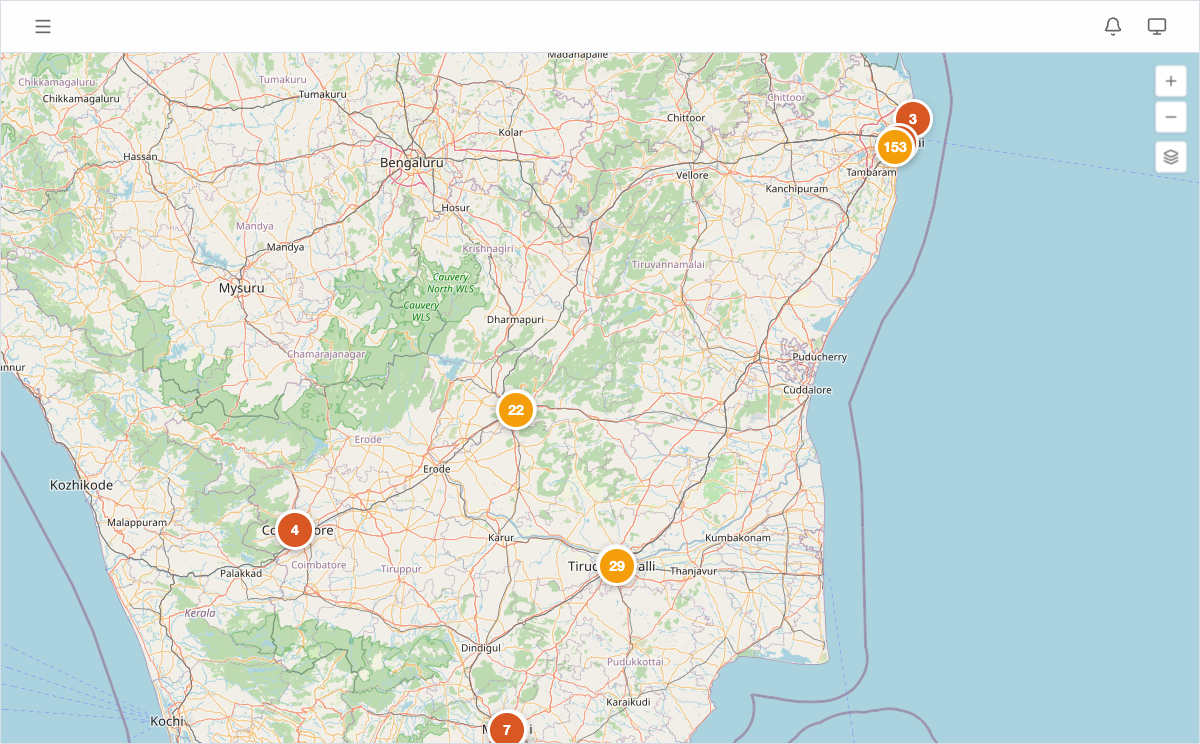
Click Map in the left sidebar. The map opens centered on your active leads, giving you an instant snapshot of your portfolio’s geographic spread.
What’s shown on the map
Lead site pins
Each lead site appears as a red pin marker. When many leads are close together, they collapse into a numbered cluster badge — zoom in to expand clusters into individual pins.
Click any lead pin to open a popup card showing:
- Site name and ID (e.g. LS-154 Paradise Gardens)
- Area in cents or square feet
- Asking price — the total asking price for the site
- Owner name
Click the card to jump straight to the full lead detail page.
Competitor price markers
Competitors appear as orange labels showing their price per sq ft (e.g. “6487.0”). The color difference from lead pins makes it easy to scan the map and immediately understand the competitive landscape.
Click any competitor marker to see:
- Project name and developer
- Type (Apartment, Villa, or Layout)
- Price/sqft
Tip: Zoom into a cluster of leads and competitors together to get a quick read on whether your asking prices are in line with the local market.
Clusters
When markers (leads or competitors) are close together at the current zoom level, they collapse into numbered circle badges. Zoom in to expand them into individual markers. The number tells you how many points are grouped, so you can prioritize dense areas for closer inspection.
Nearby places
If you have added nearby places (schools, hospitals, transit stations, etc.), they also appear on the map. Use the layer controls to toggle their visibility — useful when the map gets busy and you want to focus on one data layer at a time.
Zoom and layer controls
- Use the + / − buttons or pinch/scroll to zoom.
- The Layers toggle lets you switch between map tile options and control which marker types are visible.
Tip: Turn off competitor markers when you want to focus on your own portfolio spread, then turn them back on for pricing analysis. Layering data intentionally keeps the map readable.