The financial feasibility section on the lead site detail page helps Admins and Managers evaluate whether a land deal makes economic sense. It breaks down costs, models profitability at different price points, and generates negotiation scenarios — all based on the data you’ve entered for the site.
Note: Financial feasibility is available on all plans (Solo, Team, Pro, and Enterprise).
Investment case
At the top of the financial section you’ll see the Investment Case card. It compares your site’s economics against the local market:
- Market Avg. Price — The average price per sqft among nearby competitors within the market radius.
- Projected Selling Price — What you’d need to sell at to hit your target margin, based on total project costs.
- Required vs Market Delta — Whether your projected price is above (+) or below (−) the market average.
The card shows contextual alerts depending on the delta:
- Market Pressure Alert — Your projected price exceeds the market average (premium required).
- Competitive Headroom — Your projected price is below market (room to price competitively).
- Market Aligned — Your projected price matches the market.
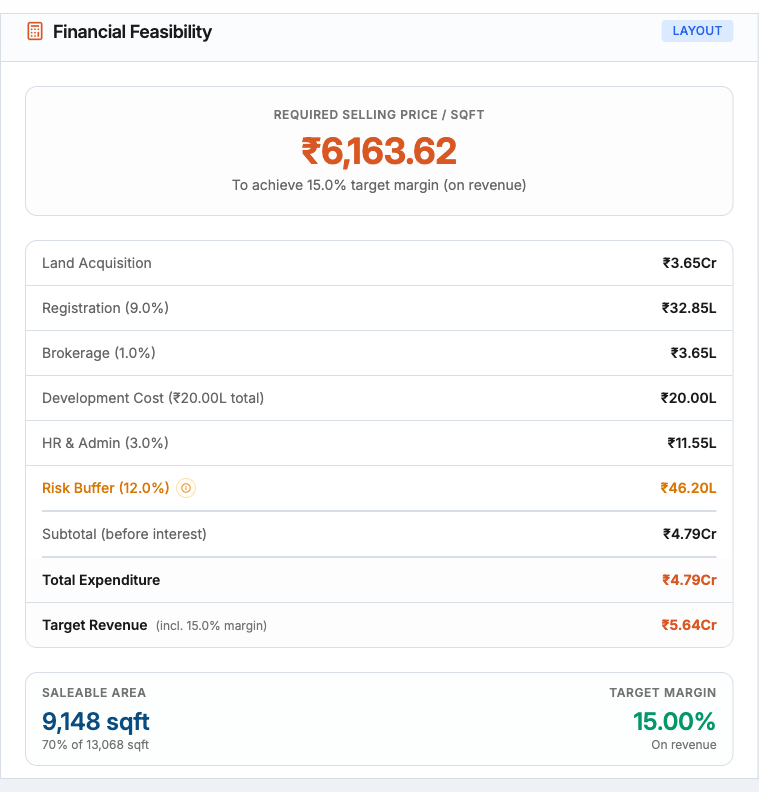
Cost breakup
The Financial Feasibility Overview card shows every cost line item in a table:
| Cost line | Description |
|---|---|
| Land Acquisition | Based on area and asking price |
| Registration | Stamp duty + registration (currently 11% for Tamil Nadu: 7% stamp + 4% registration) |
| Brokerage | Commission on the land deal |
| Land Filling | Site preparation costs |
| Construction / Development | Build cost per sqft multiplied by the development area |
| Approval & Legal | Government approvals, legal fees |
| Marketing & Sales | Advertising and sales commission |
| HR & Admin | Overhead allocation |
| Risk Buffer | A dynamic percentage based on the number and severity of active risk factors |
Below the table you’ll see Total Expenditure, Target Revenue (including your configured target margin percentage), and the Display Area used for calculations (builtup area for apartments/villas, saleable area for layouts).
Profitability calculator
The second card lets you run what-if scenarios. Enter a custom Selling Price per Sqft to see how it affects profitability:
- Estimated Profit (PAT) — Green if positive, red if a loss.
- Turnover — Total revenue at the entered price.
- Total Expenditure — Sum of all cost lines.
- PBT / Tax / PAT — Profit before tax, tax, and profit after tax.
- ROI % — Return on investment, color-coded: green (≥ 20%), yellow (≥ 10%), red (< 10%).
- Annualized ROI — Adjusted for project duration if it differs from 12 months.
- Breakeven Price — The minimum selling price per sqft to cover all costs.
- Net Margin — PAT as a percentage of turnover.
By default the calculator uses the market average price. Reset to the default at any time with the reset button.
Negotiation slabs
The third card is a sensitivity table that models the deal at multiple entry prices simultaneously. Each row shows:
| Column | What it shows |
|---|---|
| Scenario | The entry price for this row (your current asking price and target are highlighted) |
| Land Cost | Acquisition cost at that entry price |
| Total Cost | All-in project cost |
| PBT | Profit before tax (color-coded) |
| PAT | Profit after tax (color-coded) |
| ROI % | Return on investment |
| Equity Required | How much equity you need to put in (shown only when debt financing is configured) |
| Equity Multiple | PAT divided by equity invested — your return on actual cash in (shown only when debt is less than 100%) |
Enter a custom price in the input field to add your own scenario row to the table. This is especially useful during live negotiations to quickly evaluate counter-offers.
Decision banner
For Admins, a Decision Banner appears at the top of the financial section with an AI-generated executive verdict. It shows:
- A summary title and subtitle with the overall recommendation.
- The asking price, suggested entry price, and walk-away price.
- A market benchmark based on comparable competitors.
- Color coding — green (favorable), yellow (proceed with caution), red (unfavorable).
Tip: Use the negotiation slabs during calls with landowners — enter their counter-offer and instantly see whether the deal still works at your target margin.