When you open a lead site, you land on a detail page that gives you a complete picture of the land parcel — from basic site info and location to financial analysis and task tracking. Here’s a walkthrough of every section.
Layout
On desktop the page uses a two-column layout: a wide main content area on the left and a compact sidebar on the right. On mobile everything stacks into a single column with key metrics shown first.
Header and Task Pulse
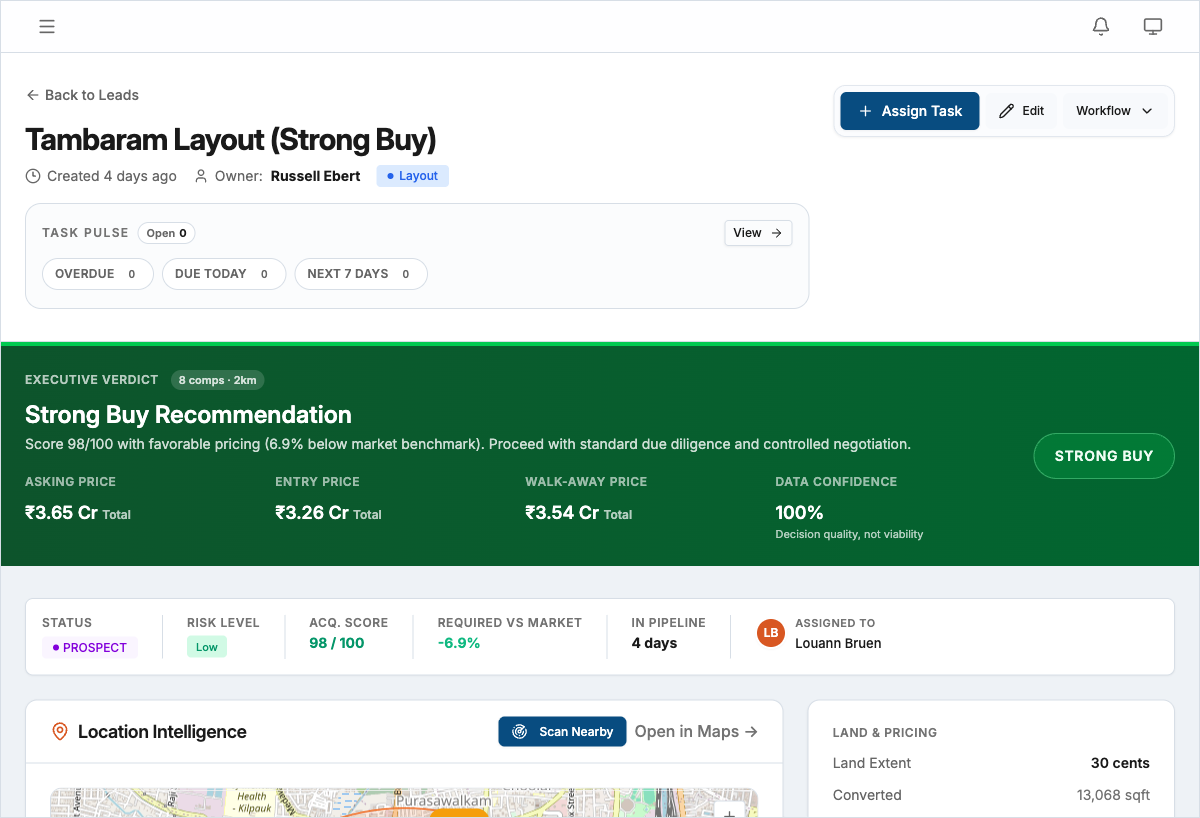
The header shows the site name, creation date, and the assigned owner. Below it you’ll see the Task Pulse bar — a row of status badges showing how many tasks are Overdue, Due Today, and Due Next 7 Days. Click any badge to jump straight to those tasks.
Action buttons in the header let you Assign Task, Edit the lead, or open the Workflow menu to promote or demote the lead’s status.
Status bar
The status bar sits just below the header and displays six key metrics at a glance:

| Metric | What it shows |
|---|---|
| Status | Current pipeline stage (Inquiry, Shortlist, Analysis, Offer, Negotiation, Closed, Dropped, or Rejected) |
| Risk Level | Color-coded risk badge — green (low), orange (medium), or red (high) — with a numeric score |
| Acquisition Score | A 0–100 score indicating overall deal quality |
| Required vs Market | Percentage delta between your projected selling price and the local market average (Admin/Manager only) |
| Days in Pipeline | How long this lead has been in the system |
| Assigned To | Profile avatar and name of the team member responsible |
Site overview card
A tabbed card with two views:
- Location tab — Village, taluk, district, state, coordinates, zone (residential, commercial, agricultural, industrial, or mixed), road width, survey number, and a Google Maps link.
- Pricing tab — Land extent in acres/hectares with sqft conversion, asking price (shown per acre, per sqft, or total depending on how it was entered), and guideline value for valuation reference.
Location intelligence
An interactive map shows the lead site’s pin along with nearby competitors and nearby places. Competitor markers are clickable and show the competitor name, developer, and price. Click Fetch Market Intel to scan for nearby competitor projects and infrastructure — schools, hospitals, temples, transit stops — within the surrounding area. Results appear in the Competitors and Nearby Places sections below. Click Open in Maps to view the location in Google or Apple Maps.
Media and documents
Upload site photos and supporting documents (title deeds, survey maps, PDFs) directly from the detail page. Photos display in a grid gallery; documents are listed with file type and upload date. See Uploading documents for details.
Sidebar
The sidebar (visible on desktop, collapsed on mobile) contains:
- Lead Snapshot — Quick-reference card showing land extent, sqft conversion, asking price per sqft, and guideline value per sqft.
- Tasks — A compact task list grouped by status (Overdue, Due Today, Next 7 Days) with an Add Task button. Solo and Team users see an upgrade prompt — tasks require Pro or above.
- Owner Information — Landowner contact details pulled from the lead’s owner fields.
- Recent Activity — A chronological feed of every action on this lead — status changes, document uploads, task updates — with pagination. This log is immutable and cannot be edited or deleted.
Role-based visibility
Not every section is visible to every role. Financial sections like the Investment Case, Financial Feasibility, Decision Banner, and Negotiation Strategy are restricted to Admin and Manager roles. Risk Assessment is visible to all roles.
Tip: Bookmark frequently revisited leads in your browser — the URL is stable and shareable with teammates who have access.