Every lead site in Proquiro has a risk assessment section that quantifies how risky the deal is. The risk score feeds directly into the financial feasibility calculations by adjusting the risk buffer — higher risk means a larger financial cushion.
Risk level and score
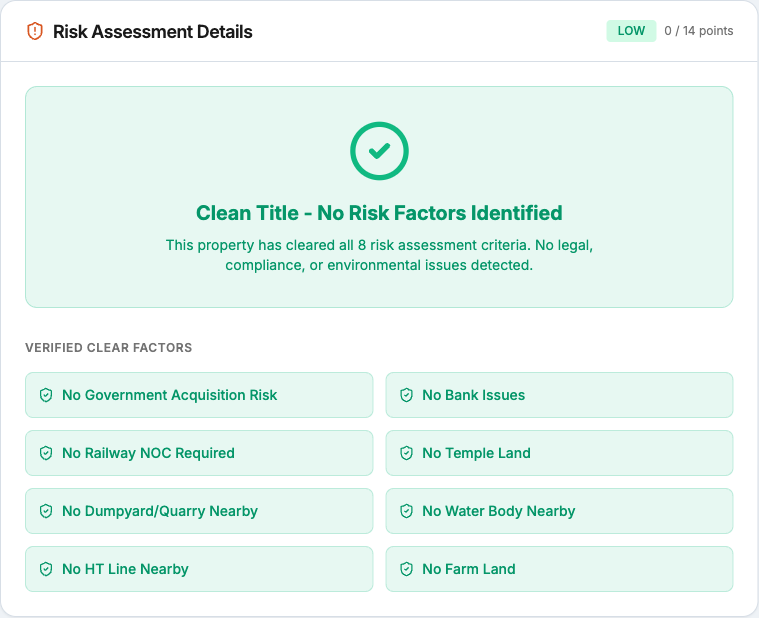
The risk level is shown as a color-coded badge on the lead site’s status bar and in the risk assessment section:
- Green — Low risk
- Orange — Medium risk
- Red — High risk
The numeric score (e.g., 42 out of 100) is the sum of all active risk factor weights. A higher score means more risk.
Active risk factors
Below the risk badge you’ll see a list of every active risk factor for this lead, sorted by financial impact (highest first). Each risk factor shows:
- Rate applied — The percentage added to the risk buffer (e.g., 5%).
- Cost base affected — Which cost category the risk impacts: project cost, approval-sensitive cost, development cost, or asking value.
- Impact amount — The rupee amount this risk factor adds to the overall project cost.
Risk factors are configured at the account level and applied based on the characteristics of each lead site — location, document status, legal clearances, and other due diligence inputs.
How risk affects financials
The risk buffer in the financial feasibility cost breakup is not a fixed percentage — it’s calculated dynamically from the active risk factors. When you resolve a risk (e.g., obtaining a clear title or securing an approval), the risk buffer shrinks and total project cost decreases, which improves ROI and profitability metrics automatically.
A popover on the risk buffer line in the cost breakup table explains the calculation logic and links back to the risk assessment section for details.
Negotiation strategy
For Admins and Managers, a Negotiation Strategy card appears alongside the risk assessment. It shows:
- Nearest Comparable — The closest competitor by distance, with name, developer, distance, and price per sqft.
- Walk-Away Price — The lowest price your team should accept in negotiations.
- Entry Price — The recommended starting bid.
These figures factor in the risk profile, so a high-risk site will have a wider spread between entry and walk-away prices to account for uncertainty.
Tip: Review the risk assessment before every negotiation round — newly resolved risks can shift your walk-away price and give you more room to negotiate.